Could somebody show or explain me, how looks in WPT a waterfall of page, which loads from server cache?
There is no way to know from the browser unless the server adds a HTTP response header saying if it was served from cache or not (a lot of CDN’s add a header). For that you can click on any request to see the response headers.
If you’ve well optimized your site, you can run WebPageTest with the advanced option “First View and Repeat View” as well as running multiple test iterations (the default 3 runs will be fine).
The first iteration is likely an empty “server” cache unless your site already has a lot of public traffic geographically distributed. The 2nd view is likely a warmed up server and CDN. The 2nd test “repeat view” is likely a warmed up server/CDN AND warmed up browser cache. So those are your 3 cases, where each case should improve over the last in terms of performance.
I will include 3 waterfalls below to illustrate the progression of each cache layer:
[list=1]
[]Empty browser cache (local) + Empty CDN Cache (server) - Fully Loaded 1.078s
[]Empty browser cache (local) + WARM CDN Cache (server) - Fully Loaded 0.500s
[*]Full Browser Cache (local) - Fully Loaded 0.191s
[/list]
Obviously this is a well optimized website to illustrate what “can be done” in theory (also doesn’t have too much visual complexity or fancy features as of the date of this post).
[size=large][First View - Empty Browser Cache - Cold CDN Cache][/size]

[size=large][First View - Empty Browser Cache - WARM CDN Cache]
[/size]

[size=large][Repeat View - All Cacheable Assets in Cache][/size]

[size=large][VERIFY the warm CDN cache (“server” cache)][/size]
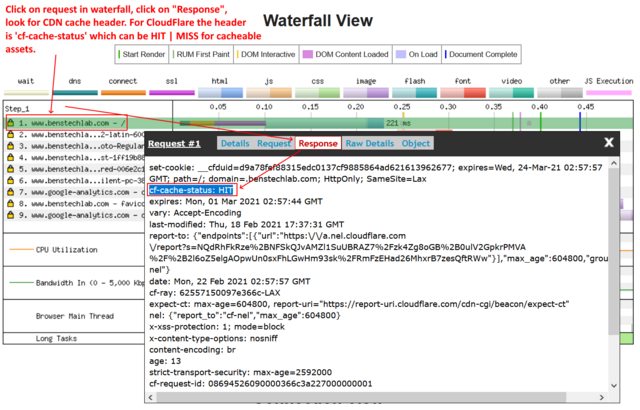
Note #1: Different CDN’s will have different headers, but as @pmeenan said I think all of them do surface the cache hit/miss in some fashion. Cloudflare can also show you your hit/miss statistics in their dashboard (sometimes CDNs slow your site down if you have very low or widely distributed traffic as every requests ends up being a cache miss and request to origin).
Note #2: The first waterfall above can be much longer when geographically further away. In my case it was going from Vancouver, BC, Canada to California which is some distance (latency) but it gets even worse if you test from east coast USA, and even worse yet if you test from Europe as the request to origin is increasing in latency when the CDN is cold. However, the 2nd and 3rd waterfalls should remain almost constant from anywhere in the world (once the local CloudFlare edge location is warmed up and/or the end user’s browser cache is warmed up).
These screenshots are taken from the median result in this test run: [url=https://webpagetest.org/result/210222_DiHY_c8d1de310203b468d0fc95f3507fc0fb/]https://webpagetest.org/result/210222_DiHY_c8d1de310203b468d0fc95f3507fc0fb/[/url]